Stochastic Gradient Descent with Tensorflow and Keras Framework
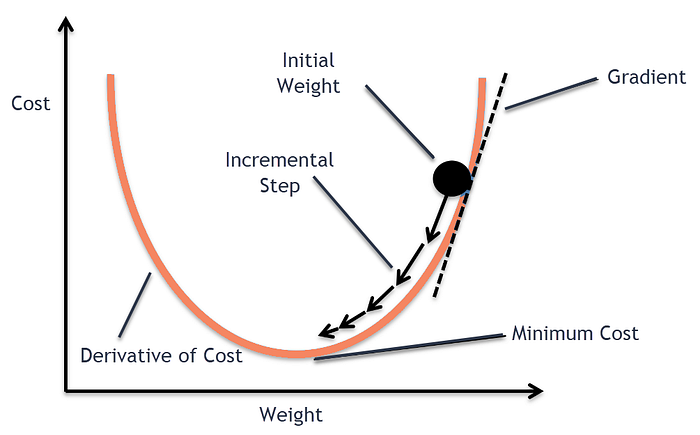
โดยในบทความนี้ ให้ทำความเข้าใจพฤติกรรมการเคลื่อนที่ของ Loss Value ในแต่ละรอบของการ Train Model แบบ Linear Regression โดยใช้ Tensorflow และ Keras Framework ซึ่งจะมีวิธี 2 แบบ
- Gradient Descent คำนวนข้อมูลทั้งหมดทีเดียว
- Stochastic Gradient Descent คำนวนแค่บางส่วน (sample)
Gradient Descent Algorithm
Gradient descent เป็นอัลกอรึทึมที่อัพเดพค่า Weight และ Bias วนซ้ำไปเรื่อยๆ เพื่อลด Cost function ให้น้อยที่สุด จากการคำนวณ Gradient(ความชัน) ณ จุดที่เราอยู่แล้วพยายามเดินไปทางตรงข้ามกับ ความชัน ถ้านึกภาพเวลาเราเดินขึ้นภูเขา วิธีการเดินไปให้ถึงจุดสูงสุดคือเราไต่ขึ้นทางที่ชันขึ้นเพื่อไปถึงจุดสูงสุด
อัลกอริทีมที่ใช้หาจุดต่ำสุดหรือสูงสุดของ function ยกตัวอย่างกราฟรูปพาราโบลาหงายไปด้านล่าง y = 2x² + x + 1 ซึ่งมี gradient เท่ากับ y =4x + 1 เราสามารถเริ่มที่จุดใดๆก็ได้บนพาราโบลา เช่น x=10 จากนั้นการจะไปที่จุดต่ำสุด เราแค่หา gradient ของ ณ จุดที่ยืนอยู่แล้วพยายามเลื่อน x ไปในทิศทางตรงข้ามกับ gradient และถ้าเราทำแบบเดียวกันหลายๆครั้ง x ก็จะลู่เข้าสู่จุดต่ำลงเรื่อยๆ และสิ้นสุดเมื่อถึงค่า x ที่ gradient มีค่าเท่ากับศูนย์
Two Dimensional Parabola Graph
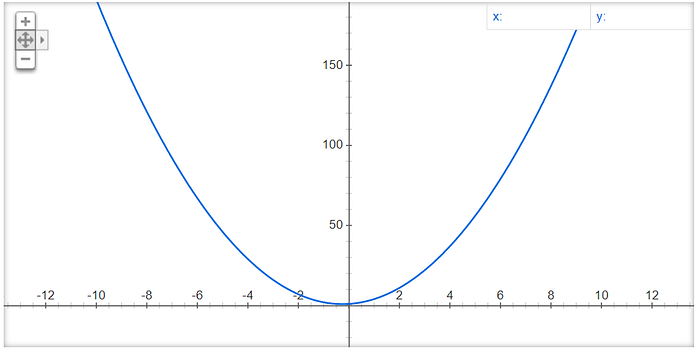
ถ้า x เท่ากับ -3 ความชันของกราฟพาราโบลาจะมีค่าเท่ากับ -11
Gradient = 4x + 1
         = 4(-3) + 1
         = -11
ในการ Train Model จริง จึงต้องมีการ Update ค่า x ด้วยค่าที่ไม่มาก โดยการทำให้ Gradient มีขนาดเล็กลง ด้วยการคูณด้วย Learning Rate ที่มีค่าอยู่ระหว่าง 0.0 ถึง 1.0 ตามสมการด้านล่าง
Learning_Rate = 0.01
Update x = x - Learning_Rate*Gradient
         = (-3)-(0.01)(-11)
         = -2.89
Workshop
Linear Regression with Tensorflow
ก่อนเริ่มจะสร้าง Environment ใหม่ ตั้งชื่อเป็น sgd สำหรับรัน Python Version 3.7 และติดตั้ง Tensorflow Package โดยใช้คำสั่งดังนี้
conda create -n sgd python=3.7 tensorflow jupyterเข้าใช้ Environment ใหม่ โดยพิมพ์คำสั่ง conda activate ตามด้วยชื่อ Environment
conda activate sgdตามด้วย jupyter notebook จะเข้ามาหน้า home ของ jupyter
หลังจากเปิด jupyter เสร็จแล้วมาเริ่มที่ Tensorflow Framework จาก dataset ชื่อไฟล์ weatherHistory.csv ตามขั้นตอนต่อไปนี้
- Import Library ที่จะใช้งาน
import tensorflow as tf

import pandas as pd
import numpy as np
import matplotlib.pyplot as plt
import seaborn as seabornInstance
from sklearn.model_selection import train_test_split
from sklearn import metrics

%matplotlib inline
2. กำหนด Random Seed และจำนวน Epoch ที่จะ Train
np.random.seed(seed=13)EPOCH = 500
3. อ่านไฟล์มาเก็บไว้ที่ ตัวแปร dataset โดยนำข้อมูลใน Column Apparent Temperature เป็น independent variable (ตัวแปรต้น) และ Column Humidity เป็น dependent variable(ตัวแปรตาม) และดูขนาด row และ column
dataset = pd.read_csv('weatherHistory.csv')
dataset.shape
4. Plot Apparent Temperature และ Humidity เพื่อดูลักษณะของข้อมูล
dataset.plot(x='Apparent Temperature (C)', y='Humidity', style='*')
plt.title('Apparent Temperature (C) vs Humidity')
plt.xlabel('Apparent Temperature (C)')
plt.ylabel('Humidity')
plt.savefig('Temperature_Humidity_temp.jpeg', dpi=300)
plt.show()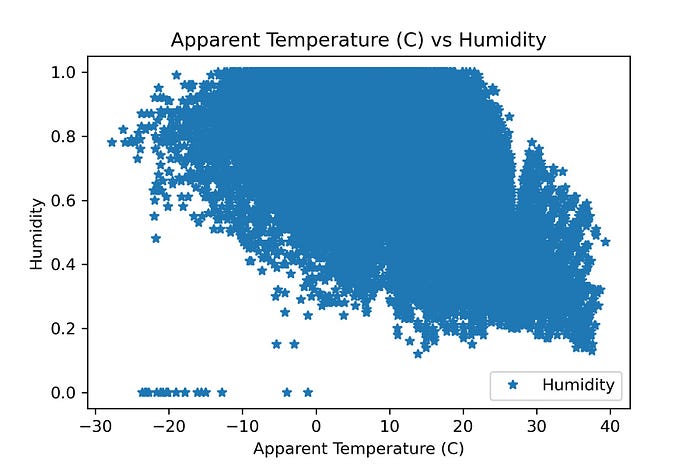
5. ดูการกระจายตัวของ Humidity
plt.figure(figsize=(15,10))
plt.tight_layout()
seabornInstance.distplot(dataset['Humidity'])
# plt.savefig('dis_Humidity_temp.jpeg', dpi=300)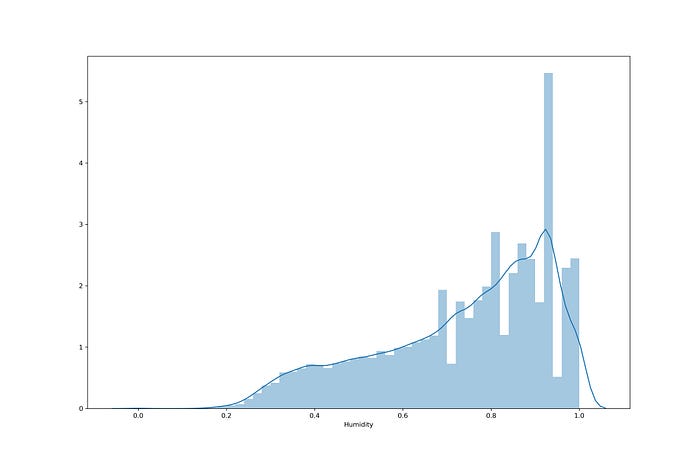
6. แยกข้อมูลออกเป็น 2 ส่วนคือ Apparent Temperature (X)และ Humidity (y)
X = dataset['Apparent Temperature (C)'].values.reshape(-1,1)
y = dataset['Humidity'].values.reshape(-1,1)X.shape

7. แบ่งข้อมูลออกเป็น 2 ชุด คือ
1) ชุดของข้อมูลสอน training set เป็น 80%
2) ชุดของข้อมูลทดสอบ testing set เป็น 20%
X_train, X_test, y_train, y_test = train_test_split(X, y, test_size=0.2, shuffle= True)X_train.shape, X_test.shape, y_train.shape, y_test.shape

8. นิยาม Model ด้วย Tensorflow โดยจะมีการนำ X_train เข้า Model ทั้งหมด
W = tf.Variable(tf.random.uniform([1], -1.0, 1.0))
b = tf.Variable(tf.random.uniform([1], -1.0, 1.0))y = W * X_train + b
9. นิยาม Loss Function แบบ Mean Squared Error (MSE)
loss = tf.reduce_mean(tf.square(y - y_train))10. กำหนด Optimizer และ Learning Rate
Optimization คือ การหาจุดที่เหมาะสมที่สุด (Optimal Point) จะทำการเปลี่ยนแปลงค่า Weight และค่า Bias
optimizer = tf.train.GradientDescentOptimizer(0.0001)train = optimizer.minimize(loss)
โดย Optimizer จะมีการทำ Back-propagation Algorithm เพื่อปรับค่า Weight (W) และ Bias (b) ให้อัตโนมัติ โดยไม่ต้องมีการหาอนุพันธ์ด้วยตัวเอง
11. เคลียร์ Tensorflow Variable
init = tf.global_variables_initializer()12. สร้าง session และรัน init เพื่อเคลียร์ค่า Variable จริงๆ
sess = tf.Session()
sess.run(init)
13. Train Model (sess.run(train))
his=[]
wb = []

for step in range(EPOCH):
    sess.run(train)
    his.append(sess.run(loss))
    print(step, sess.run(W), sess.run(b), sess.run(loss))
    wb.append([sess.run(W)[0], sess.run(b)[0], sess.run(loss)])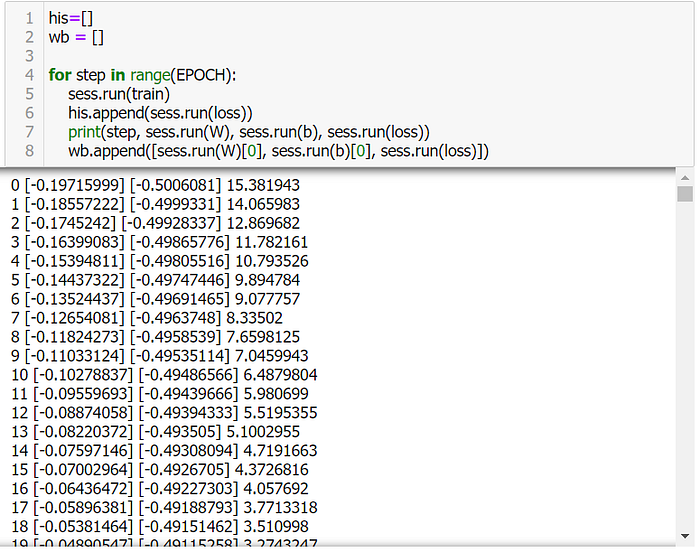
14. ดึง Weight (W) และ Bias (b) มาสร้าง Linear Regression Model
M = sess.run(W)
C = sess.run(b)
15. นิยาม Function Predict
def predict(X, M, C):
    y = M*X+C
    return y[0]
16. แปลง Loss Value List เป็น DataFrame
df = pd.DataFrame(his, columns=['loss'])17. Plot Loss
import plotly
import plotly.graph_objs as go

plotly.offline.init_notebook_mode(connected=True)

h1 = go.Scatter(y=df['loss'],
                    mode="lines", line=dict(
                    width=2,
                    color='blue'),
                    name="loss")

data = [h1]

layout1 = go.Layout(title='Loss',
                   xaxis=dict(title='epochs'),
                   yaxis=dict(title=''))
fig1 = go.Figure(data, layout=layout1)
plotly.offline.iplot(fig1)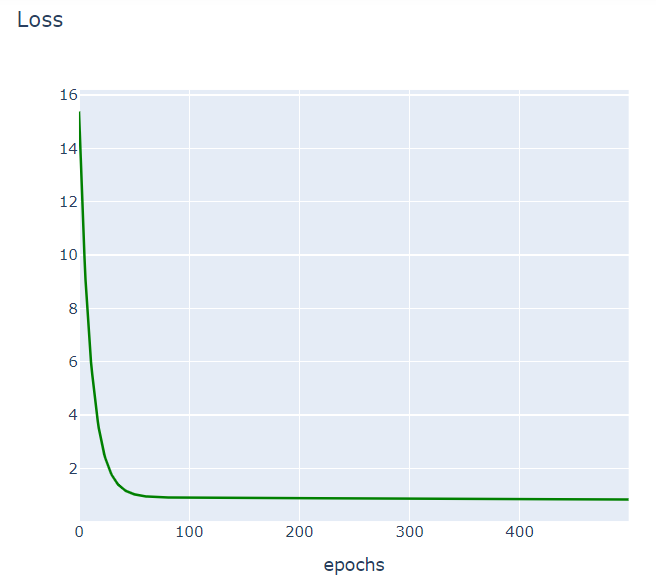
18. Predict Humidity (y)
y_pred = [predict(i, M, C) for i in X_test]

y_test.shape
y_test = y_test.reshape(-1)
y_test.shape
19. แสดงผลการ Predict 15 แถวแรก
df = pd.DataFrame({'Actual': y_test, 'Predicted': y_pred})
df.head(15)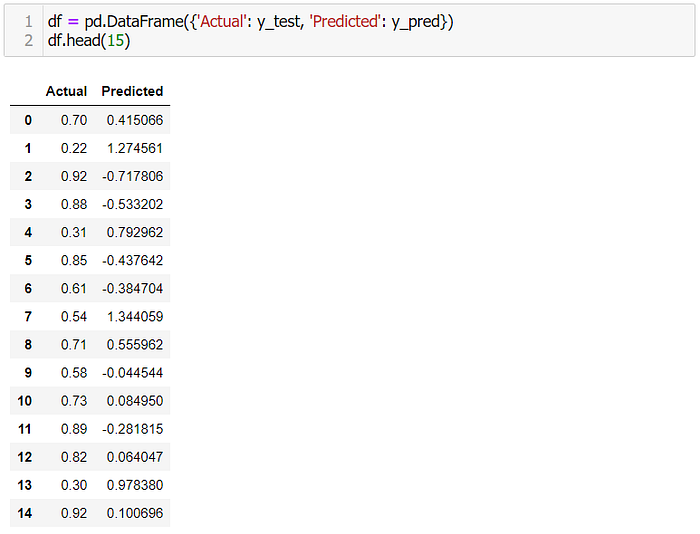
20. Plot กราฟเปรียบเทียบผลการทำนายกับค่าจริง
df1 = df.head(25)
df1.plot(kind='bar',figsize=(16,10))
plt.grid(which='major', linestyle='-', linewidth='0.5', color='green')
plt.grid(which='minor', linestyle=':', linewidth='0.5', color='black')
plt.show()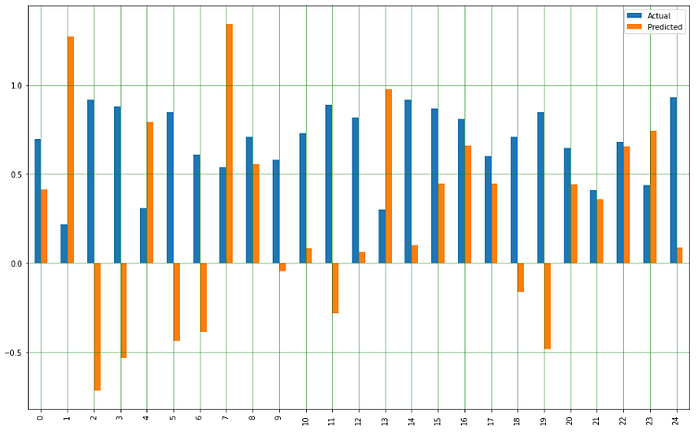
21. แสดง Model ที่สร้างจากการ Train ใน Epoch ที่ 10
y_pred = [predict(i, M[9], C[9]) for i in X_test]

plt.scatter(X_test, y_test,  color='gray')
plt.plot(X_test, y_pred, color='red', linewidth=2)
plt.savefig('10_model.jpeg', dpi=300)
plt.show(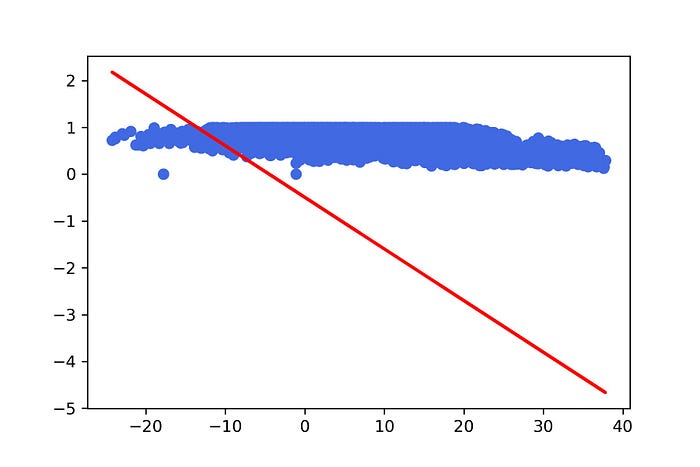
22. แสดง Model ที่สร้างจากการ Train 100 Epoch
y_pred = [predict(i, M[99], C[99]) for i in X_test]plt.scatter(X_test, y_test,  color='royalblue')
plt.plot(X_test, y_pred, color='red', linewidth=2)
plt.show()
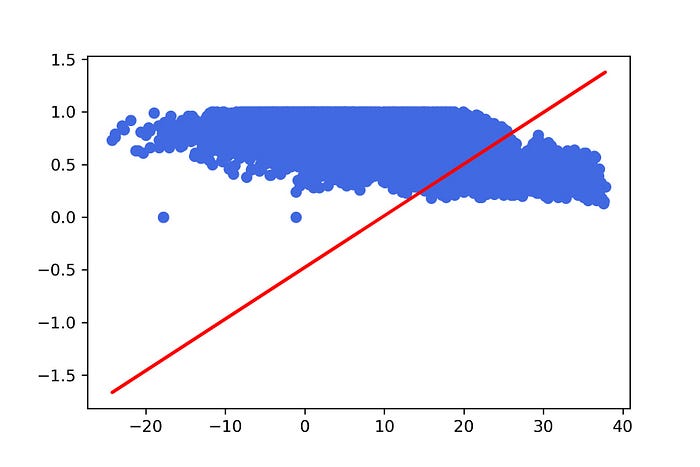
23. ดู Loss Value เทียบกับค่า Weight
plt.scatter(M, L,  color='royalblue')
plt.savefig('weight.jpeg', dpi=300)
plt.show()
24. ดู Loss Value เทียบกับค่า Bias
plt.scatter(C, L, color='royalblue')
plt.savefig('bias.jpeg', dpi=300)
plt.show()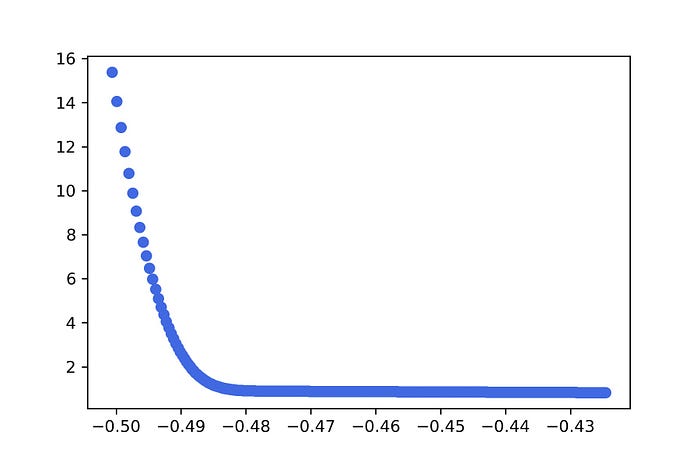
25. ดู Loss Value เทียบกับค่า Weight และ Bias
import plotly.express as pxdf = pd.DataFrame({'W' : M, 'Bias' : C, 'Loss' : L})
fig = px.scatter_3d(df, x='W', y='Bias', z='Loss')
fig.show()
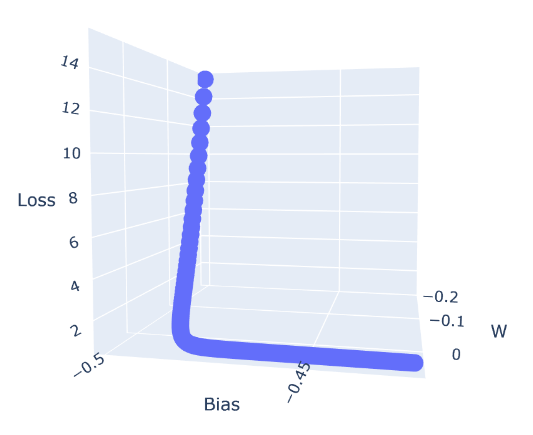
26. วัดประสิทธิภาพของ Model ด้วย Mean Absolute Error, Mean Squared Error และ Root Mean Squared Error
print('Mean Absolute Error:', metrics.mean_absolute_error(y_test, y_pred))
print('Mean Squared Error:', metrics.mean_squared_error(y_test, y_pred))
print('Root Mean Squared Error:', np.sqrt(metrics.mean_squared_error(y_test, y_pred)))
Stochastic Gradient Descent Method Linear Regression with Keras
การสุ่มแบ่ง Dataset เป็นขนาดเล็กๆ (Batch Size) เพื่อนำไป Train Model
- Import Library ที่จะใช้งาน
from tensorflow.python.keras.models import Sequential
from tensorflow.python.keras.layers import Densefrom keras import backend as K
2. นิยาม Root Mean Squared Error
def rmse(y_true, y_pred):
    return K.sqrt(K.mean(K.square(y_pred - y_true), axis=-1))
3. นิยาม Model
model = Sequential()
model.add(Dense(1, input_dim=1, kernel_initializer='random_uniform', activation='linear'))
model.summary()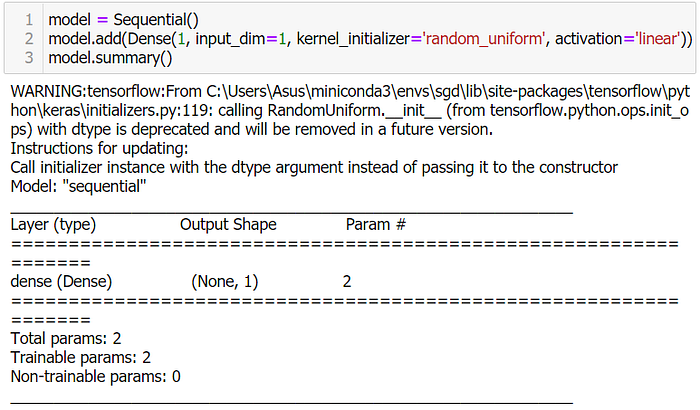
4. Compile Model
model.compile(loss='mse', optimizer='adam', metrics=['mae', 'mse', rmse])5. Train Model โดยการสุ่มแบ่งข้อมูลสำหรับ Train 80% และ Validate อีก 20% โดยกำหนด Batch Size เท่ากับ 64
history = model.fit(X_train, y_train, epochs=EPOCH, batch_size=64, verbose=1, validation_split=0.2, shuffle=True)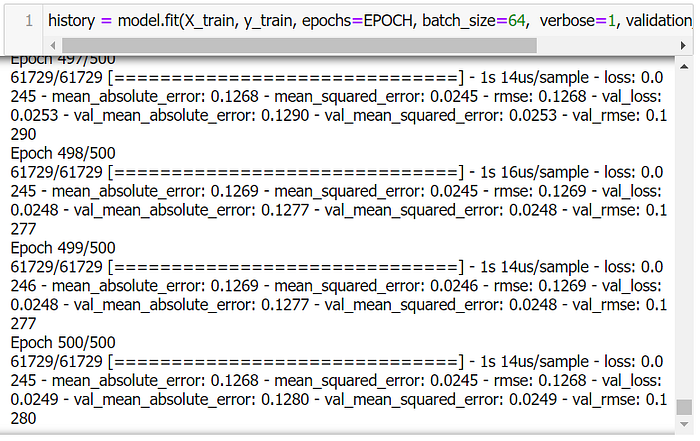
6. Plot Loss และ Validate Loss
h2 = go.Scatter(y=history.history['loss'],
                    mode="lines", line=dict(
                    width=2,
                    color='blue'),
                    name="loss")h3 = go.Scatter(y=history.history['val_loss'],
                    mode="lines", line=dict(
                    width=2,
                    color='green'),
                    name="val_loss")

data = [h2, h3]layout1 = go.Layout(title='Loss',
                   xaxis=dict(title='epochs'),
                   yaxis=dict(title=''))
fig1 = go.Figure(data, layout=layout1)
plotly.offline.iplot(fig1)

7. Predict
y_pred = model.predict(X_test)8. แปลงเป็น DataFrame
y_pred = y_pred.flatten()df = pd.DataFrame({'Actual': y_test, 'Predicted': y_pred})
9. Plot กราฟเปรียบเทียบผลการทำนายกับค่าจริง
df1 = df.head(25)
df1.plot(kind='bar',figsize=(16,10))
plt.grid(which='major', linestyle='-', linewidth='0.5', color='green')
plt.grid(which='minor', linestyle=':', linewidth='0.5', color='black')
plt.show()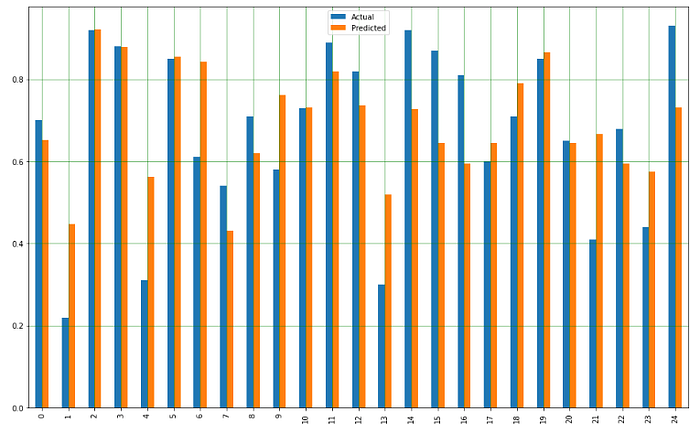
10. แสดง Model ที่สร้างจากการ Train 500 Epoch
plt.scatter(X_test, y_test,  color='gray')
plt.plot(X_test, y_pred, color='red', linewidth=2)
plt.savefig('keras_500_model.jpeg', dpi=300)
plt.show()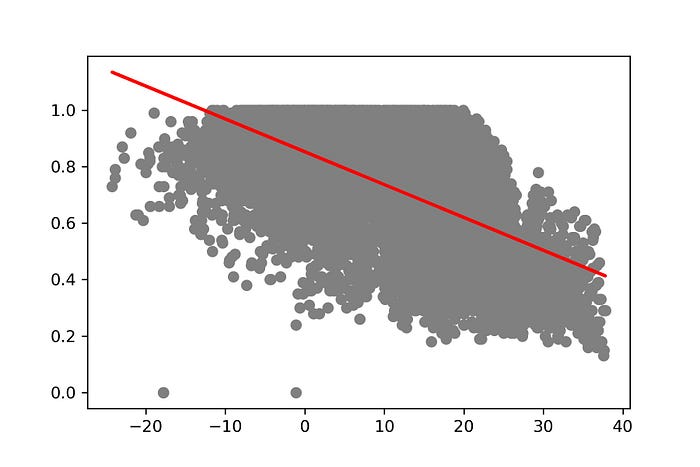
11. วัดประสิทธิภาพของ Model ด้วย Mean Absolute Error, Mean Squared Error และ Root Mean Squared Error
print('Mean Absolute Error:', metrics.mean_absolute_error(y_test, y_pred))
print('Mean Squared Error:', metrics.mean_squared_error(y_test, y_pred))
print('Root Mean Squared Error:', np.sqrt(metrics.mean_squared_error(y_test, y_pred)))
จากวิธีทั้ง 2 แบบ Gradient Descent และ Stochastic Gradient Descent สามารถเปรียบเทียบค่า Mean Absolute Error และ Mean Squared Error จะเห็นค่าความแตกต่าง ใน Gradient Descent with Tensorflow จะใช้เวลาไม่นาน แต่ Stochastic Gradient Descent with Keras จะใช้เวลานานกว่า
