The Effects of the Learning Rate on Model Performance

Learning Rate เป็น Hyperparameter มีหน้าที่ในการปรับขนาดของ Error ในแต่ครั้งของการปรับปรุง Weight และ Bias ด้วย Back-propagation Algorithm การปรับเปลี่ยน Learning Rate มีผลกระทบกับประสิทธิภาพของ Model มาก
ผลลัพธ์ที่เกิดจากการปรับเปลี่ยนค่า Learning Rate ด้วยวิธีการต่างๆ ได้แก่
- Momentum
2. Learning Rate Decay,
3. การลด Learning Rate เมื่อเจอกับที่ราบสูง (Plateau)
4. การใช้ Adaptive Learning Rate Algorithm เพื่อปรับค่า Learning Rate แบบอัตโนมัติ
Impact of Learning Rate
เราจะใช้ MNIST Dataset ซึ่งเป็นภาพตัวเลขที่เขียนด้วยลายมือ แบบ Grayscale จำนวน 70,000 ภาพ ขนาด 28x28 Pixel
เริ่มด้วยการ import library ที่ต้องใช้
import tensorflow as tf

import pandas as pdimport matplotlib.pyplot as plt
%matplotlib inline

# Import Keras libraries
from tensorflow.keras.models import Sequential
from tensorflow.keras.layers import Dense
from tensorflow.keras.layers import Flattenfrom pandas import get_dummiesimport numpy as np
โหลด mnist model ที่ใช้ในครั้งนี้
mnist = tf.keras.datasets.mnist
(X_train, y_train), (X_test, y_test) = mnist.load_data()
แบ่งข้อมูล Train กับ Test
X_train, X_test = X_train / 255.0, X_test / 255.0# flatten input
X_train = np.array([X.flatten() for X in X_train])X_test = np.array([X.flatten() for X in X_test])
ดูขนาดข้อมูล
X_train.shape, y_train.shape, X_test.shape, y_test.shape
from tensorflow.keras.layers import Dense
from tensorflow.keras.models import Sequential
from tensorflow.keras.optimizers import SGD
from tensorflow.keras.utils import to_categoricalfrom sklearn.datasets import make_blobs
from matplotlib import pyplot
from numpy import wherefrom sklearn.model_selection import train_test_splitimport pandas as pd
import plotly.express as px
นำ Dataset ส่วนที่ Train มาแปลงเป็น DataFrame โดยเปลี่ยนชนิดข้อมูลใน Column “class”
X_train_pd = pd.DataFrame(X_train)
y_train_pd = pd.DataFrame(y_train, columns=[‘class’])df = pd.concat([X_train_pd, y_train_pd], axis=1)
df[“class”] = df[“class”].astype(str)
y_train = to_categorical(y_train)
y_test = to_categorical(y_test)
นิยาม Model, Complie Model และ Plot Accuracy
def fit_model(trainX, trainy, testX, testy, lrate):
 model = Sequential()
 model.add(Flatten(input_shape=(28,28)))
 model.add(Dense(units = 50, activation = ‘relu’, kernel_initializer=’he_uniform’))
 model.add(Dense(units = 10, activation=’softmax’))

 opt = SGD(lr=lrate)
 model.compile(loss=’categorical_crossentropy’, optimizer=opt, metrics=[‘accuracy’])

 history = model.fit(trainX, trainy, validation_data=(testX, testy), epochs=50, verbose=0)pyplot.plot(history.history[‘accuracy’], label=’train’)
 pyplot.plot(history.history[‘val_accuracy’], label=’test’)
 pyplot.title(‘lr=’+str(lrate), pad=-35)learning_rates = [1E-0, 1E-1, 1E-2, 1E-3, 1E-4, 1E-5, 1E-6, 1E-7]
for i in range(len(learning_rates)):
 plot_no = 420 + (i+1)
 pyplot.subplot(plot_no)
 fit_model(X_train, y_train, X_test, y_test, learning_rates[i])
pyplot.tight_layout()
pyplot.savefig(‘lr1.jpeg’, dpi=300)
pyplot.show()
Train เสร็จแล้ว จะเห็นกราฟ Accuracy หรือ Learning Curve ของ Model
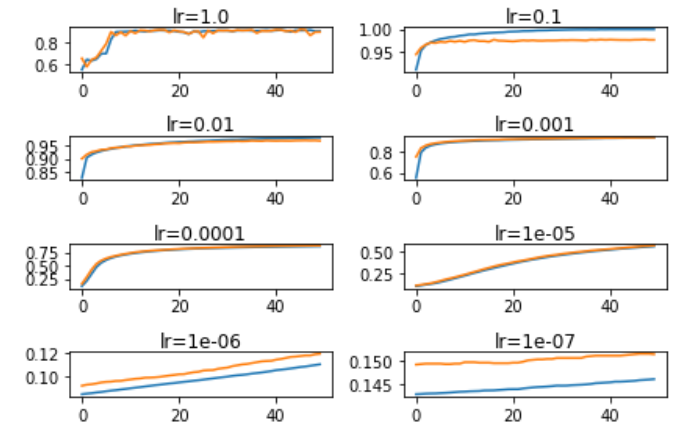
จาก output เส้นกราฟสีฟ้า คือ Accuracy และสีส้ม คือ Validate Accuracy จะเห็นว่า lr =1.0 , 0.1 , 0.01 , 0.001 มีอัตราการเรียนรู้สูง คือ มี Accuracy สูงกว่า 80% แต่ในช่วงแรกอาจจะไม่มีอัตรการเร่งการเรียนรู้เท่าไหร่ ส่วน lr ที่เหลือมีการเรียนรู้ค่อนข้างต่ำ
Momentum
เป็นเทคนิคในการลดการแกว่งของ Learning Curves พร้อมกับเร่งอัตราการเรียนรู้ของ Model ให้เร็วขึ้น โดยใช้ Velocity (ความเร็ว) ของรอบก่อนหน้า และ Error ในรอบปัจจุบันเพื่อปรับปรุง Weight และ Bias ด้วยค่าน้ำหนักตามที่กำหนด ซึ่งโดยปกติจะมีการให้น้ำหนัก Velocity ในรอบก่อนหน้ามากกว่า Error ในรอบปัจจุบัน
นิยาม Model, กำหนด lr = 0.01, Complie Model และ Plot Accuracy
def fit_model(trainX, trainy, testX, testy, momentum):
 model = Sequential()
 model.add(Flatten(input_shape=(28,28)))
 model.add(Dense(units = 50, activation = ‘relu’, kernel_initializer=’he_uniform’))
 model.add(Dense(units = 10, activation=’softmax’))opt = SGD(lr=0.01, momentum=momentum)
 model.compile(loss=’categorical_crossentropy’, optimizer=opt, metrics=[‘accuracy’])history = model.fit(trainX, trainy, validation_data=(testX, testy), epochs=50, verbose=0)pyplot.plot(history.history[‘accuracy’], label=’train’)
 pyplot.plot(history.history[‘val_accuracy’], label=’test’)
 pyplot.title(‘momentum=’+str(momentum), pad=-80)

momentums = [0.0, 0.5, 0.9, 0.99]
for i in range(len(momentums)):
 plot_no = 220 + (i+1)
 pyplot.subplot(plot_no)fit_model(X_train, y_train, X_test, y_test, momentums[i])pyplot.tight_layout()
pyplot.savefig(‘momentum.jpeg’, dpi=300)
pyplot.show()
มีอัตราการเรียนรู้ที่เร็วขึ้นกว่าตอนที่ไม่ได้ใช้ momentum อย่างเห็นได้ชัด
Learning Rate Decay
เพิ่มประสิทธิภาพของ Model ได้โดยการค่อย ๆ ลด Learning Rate (Learning Rate Decay) ในแต่ละ Epoch ในอัตราที่เหมาะสม
def decay_lrate(initial_lrate, decay, iteration):
 return initial_lrate * (1.0 / (1.0 + decay * iteration))

decays = [1E-1, 1E-2, 1E-3, 1E-4]
lrate = 0.01
n_updates = 200
for decay in decays:

 lrates = [decay_lrate(lrate, decay, i) for i in range(n_updates)]

 pyplot.plot(lrates, label=str(decay))
pyplot.legend()
pyplot.savefig(‘decay.jpeg’, dpi=300)
pyplot.show()
นิยาม Model, กำหนด lr = 0.01, Complie Model และ Plot Accuracy
def fit_model(trainX, trainy, testX, testy, decay):
 model = Sequential()
 model.add(Flatten(input_shape=(28,28)))
 model.add(Dense(units = 50, activation = ‘relu’, kernel_initializer=’he_uniform’))
 model.add(Dense(units = 10, activation=’softmax’))opt = SGD(lr=0.01, decay=decay)
 model.compile(loss=’categorical_crossentropy’, optimizer=opt, metrics=[‘accuracy’])

 history = model.fit(trainX, trainy, validation_data=(testX, testy), epochs=50, verbose=0)pyplot.plot(history.history[‘accuracy’], label=’train’)
 pyplot.plot(history.history[‘val_accuracy’], label=’test’)
 pyplot.title(‘decay=’+str(decay), pad=-80)decay_rates = [1E-1, 1E-2, 1E-3, 1E-4]
for i in range(len(decay_rates)):
 plot_no = 220 + (i+1)
 pyplot.subplot(plot_no)
 fit_model(X_train, y_train, X_test, y_test, decay_rates[i])pyplot.legend()
pyplot.savefig(‘decay2.jpeg’, dpi=300)
pyplot.show()
จะเห็นได้ว่ามีการแกว่งน้อยลงกว่าตอนที่ยังไม่ได้ใช้ decay รวมทั้งมีค่า Accuracy ที่สูง แต่ decay = 0.1 ยังไม่ค่อยมีอัตราเร่งการเรียนรู้
Drop Learning Rate
ในตอนที่ Loss Value ไม่ลดลงเป็นระยะเวลาหนึ่ง เราจะเรียกสถานการณ์นี้ว่าการเจอที่ราบสูง (Plateau) เราอาจจะใช้เทคนิคการปรับลดค่า Learning Rate ด้วยการคูณกับค่า factor
from tensorflow.keras.callbacks import Callback
from tensorflow.keras.callbacks import ReduceLROnPlateau
from tensorflow.keras import backendclass LearningRateMonitor(Callback):
 def on_train_begin(self, logs={}):
 self.lrates = list()

 def on_epoch_end(self, epoch, logs={}):
 optimizer = self.model.optimizer
 lrate = float(backend.get_value(self.model.optimizer.lr))
 self.lrates.append(lrate)

def fit_model(trainX, trainy, testX, testy, patience):
 model = Sequential()
 model.add(Flatten(input_shape=(28,28)))
 model.add(Dense(units = 50, activation = ‘relu’, kernel_initializer=’he_uniform’))
 model.add(Dense(units = 10, activation=’softmax’))opt = SGD(lr=0.01)
 model.compile(loss=’categorical_crossentropy’, optimizer=opt, metrics=[‘accuracy’])rlrp = ReduceLROnPlateau(monitor=’val_loss’, factor=0.1, patience=patience, min_delta=1E-7)
 lrm = LearningRateMonitor()
 history = model.fit(trainX, trainy, validation_data=(testX, testy), epochs=50, verbose=0, callbacks=[rlrp, lrm])
 return lrm.lrates, history.history[‘loss’], history.history[‘accuracy’]def line_plots(patiences, series, st):
 for i in range(len(patiences)):
 pyplot.subplot(220 + (i+1))
 pyplot.plot(series[i])
 pyplot.title(‘patience=’+str(patiences[i]), pad=-80)
 pyplot.legend()
 pyplot.savefig(‘patience.jpeg’, dpi=300)
 pyplot.show()

patiences = [2, 5, 10, 15]
lr_list, loss_list, acc_list, = list(), list(), list()
for i in range(len(patiences)):
 lr, loss, acc = fit_model(X_train, y_train, X_test, y_test, patiences[i])
 lr_list.append(lr)
 loss_list.append(loss)
 acc_list.append(acc)line_plots(patiences, lr_list, ‘lr’)line_plots(patiences, loss_list, ‘loss’)line_plots(patiences, acc_list, ‘acc’)
Learning Rate (แกน y) ที่ลดลง

ค่า Loss Value (แกน y) ที่เกิดจากการปรับลด Learning Rate

ค่า Accuracy (แกน y) ที่เกิดจากการปรับลด Learning Rate
Adaptive Learning Rates Gradient Descent
เปรียบเทียบ Adaptive Learning Rate Algorithm กับ Optimizer พื้นฐาน (SGD Optimizer) RMSprop (Root Mean Square Propagation) , AdaGrad (Adaptive Gradient Algorithm), และ Adam (Adaptive Moment Estimation)
def fit_model(trainX, trainy, testX, testy, optimizer):
 model = Sequential()
 model.add(Flatten(input_shape=(28,28)))
 model.add(Dense(units = 50, activation = ‘relu’, kernel_initializer=’he_uniform’))
 model.add(Dense(units = 10, activation=’softmax’))model.compile(loss=’categorical_crossentropy’, optimizer=optimizer, metrics=[‘accuracy’])

 history = model.fit(trainX, trainy, validation_data=(testX, testy), epochs=50, verbose=0)pyplot.plot(history.history[‘accuracy’], label=’train’)
 pyplot.plot(history.history[‘val_accuracy’], label=’test’)
 pyplot.title(‘opt=’+optimizer, pad=-80)momentums = [‘sgd’, ‘rmsprop’, ‘adagrad’, ‘adam’]
for i in range(len(momentums)):
 plot_no = 220 + (i+1)
 pyplot.subplot(plot_no)fit_model(X_train, y_train, X_test, y_test, momentums[i])pyplot.legend()
pyplot.savefig(‘adaptive.jpeg’, dpi=300)
pyplot.show()

